

Bank of America $1.2 billion fine: what FinCEN, OCC and OFAC found, what $5B in late SARs means, and how the lessons apply to crypto compliance.
During H1 2026, 224 publicly disclosed crypto hacks resulted in approximately $1.32 billion in losses. Our analysis identified several key trends that reveal how attacker behaviour and the industry’s response continue to evolve.
Key Takeaways
- Hack disclosure became 2 times faster, reducing the average reporting time from 37.2 hours to 17.7 hours.
- Cross-chain routing continues to serve as the primary laundering route
- Tornado Cash accounted for 70% of all tracked mixer usage, maintaining its dominant position following the lifting of U.S. sanctions.
- Three incidents generated 63.9% of all losses, while four confirmed DPRK-linked attacks accounted for 45.3% of the total value stolen.
- Recovery outcomes improved, reflecting earlier incident visibility together with increasingly coordinated intervention.
The following sections examine each finding in greater detail, highlighting the trends that shaped the crypto threat landscape during H1 2026.
Hack Disclosure Is Becoming Faster
One of the defining trends in H1 2026 was a measurable improvement in the speed at which major hacking incidents became publicly known. Compared with the previous reporting period, hacks were disclosed significantly faster, while stolen assets took slightly longer to reach their first identifiable laundering endpoint.
The average time between an incident and its public disclosure decreased by 52.4%, from 37.2 hours in H1 2025 to 17.72 hours in H1 2026. In other words, major hacks were disclosed approximately 2 times faster than a year earlier. The fastest public disclosure recorded in H1 2026 followed the Truebit incident and took just 16 minutes. H1 2025 included an even faster individual case, reported in 5 minutes and 1 second, but the improvement in the overall average shows that faster reporting is becoming more consistent across the ecosystem.
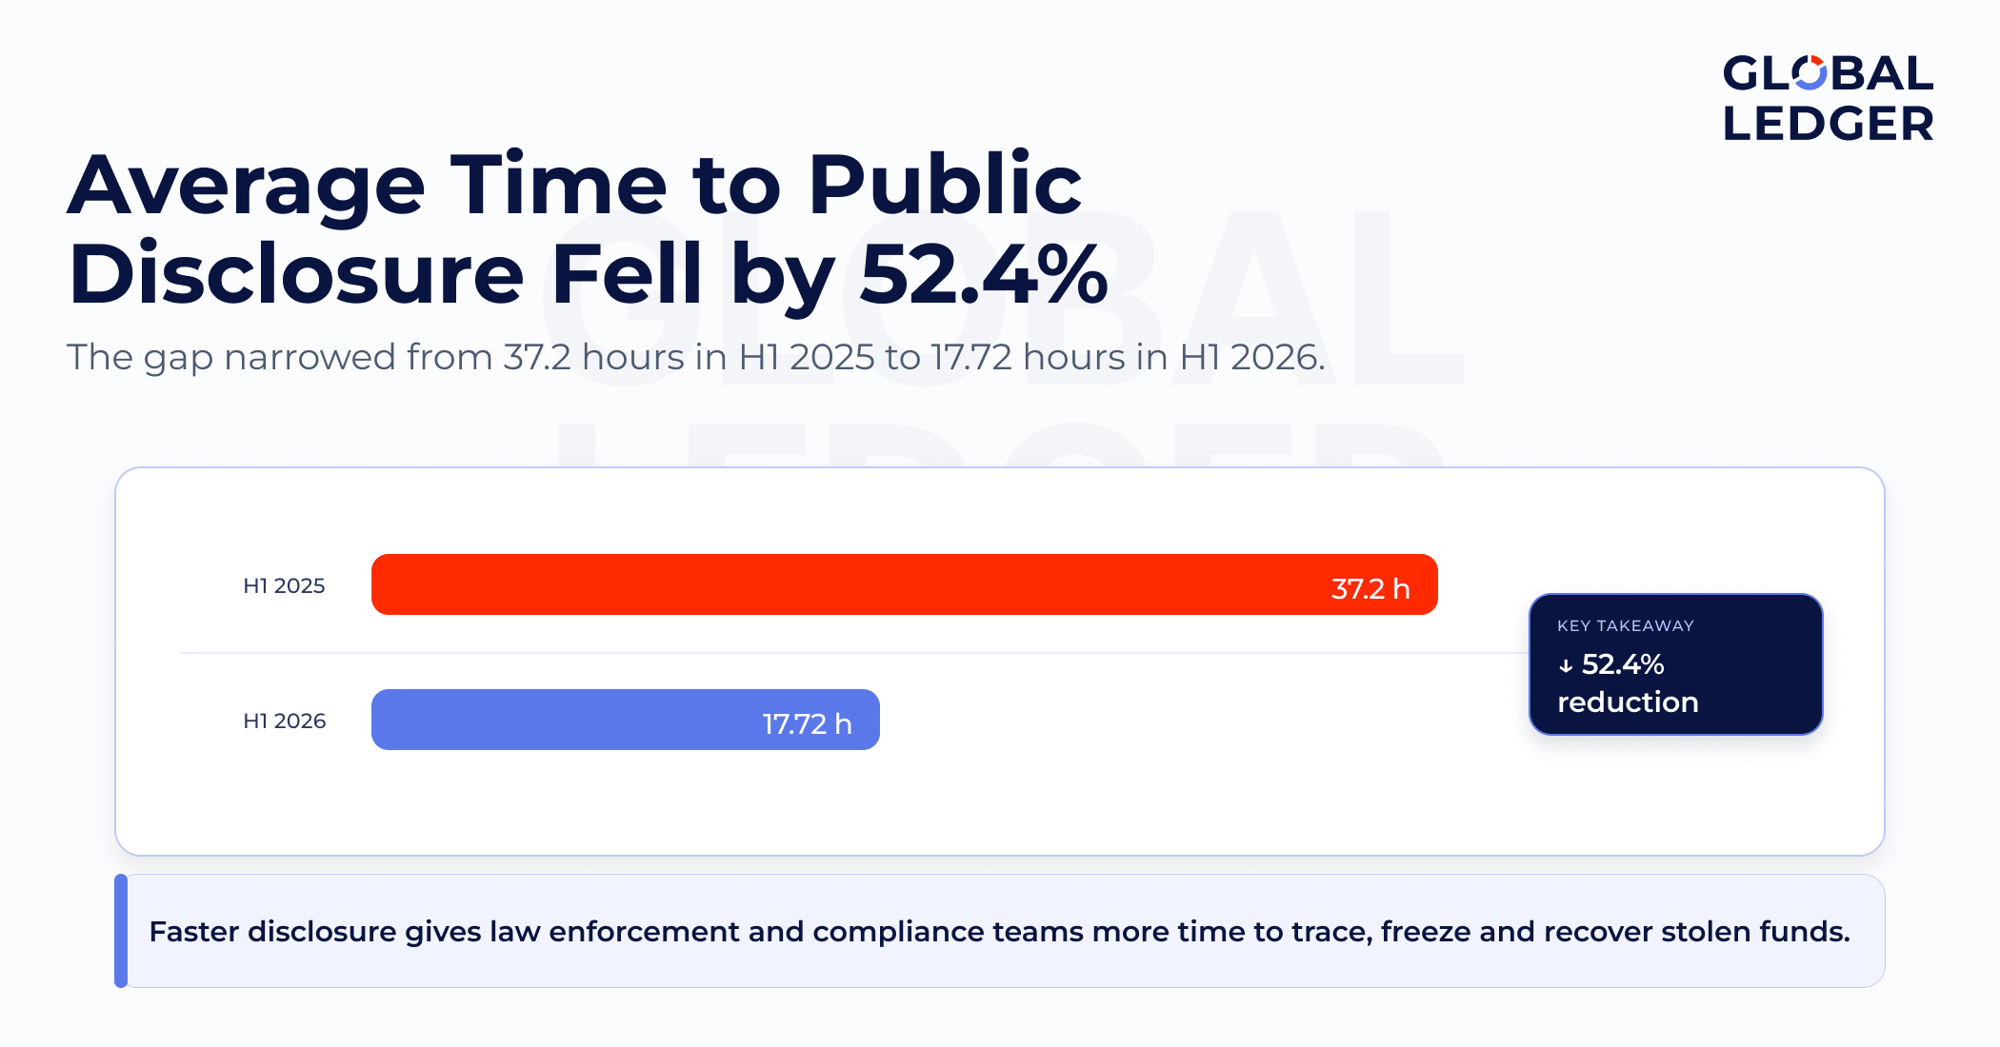
Public disclosure time reduced by 52.4%. Source: Global Ledger
As a result, the average interval between public disclosure and the first identified deposit into a VASP or mixer increased from 50.8 hours in H1 2025 to 75.5 hours in H1 2026—an expansion of 24.7 hours, or 48.6%. One plausible explanation is that earlier public disclosure is increasing operational pressure on threat actors. Once an incident becomes public, exchanges, investigators and compliance teams can begin monitoring associated addresses sooner, making early interaction with identifiable services riskier. Attackers have long used fragmentation, layering, self-hosted wallets and cross-chain routing to obscure the origin of stolen funds; in a more closely monitored environment, they need to extend these established techniques further or hold assets for longer while waiting for the immediate attention surrounding an incident to subside.
The improvement in reporting speed coincided with stronger recovery outcomes. In H1 2025, funds were recovered in 5 of 119 incidents, or 4.2%, representing 4.6% of the total value stolen. In H1 2026, recovery was recorded in 16 of 224 incidents, or 7.1%, while returned assets represented 10.86% of total losses. The share of incidents resulting in recovery therefore increased by 69%, while the proportion of stolen value returned increased by 136%.
The data does not establish that faster public reporting alone caused this improvement. Recovery also depends on the assets involved, the availability of freezing mechanisms, protocol-level intervention and negotiations with attackers. However, the two trends are closely aligned: earlier disclosure allows relevant organisations to begin identifying compromised wallets and coordinating action sooner. Overall, the findings indicate that the balance is gradually shifting in favour of defenders. Public reporting is becoming faster, attackers are taking longer to reach their first identifiable laundering endpoint, and recovery outcomes have improved compared with H1 2025.
Cross-Chain Remains the Backbone of Crypto Laundering
The structure of crypto laundering remained broadly consistent in H1 2026. Analysis of incidents with sufficiently detailed fund-tracing data shows that cross-chain routing continued to be the leading method used to move stolen assets, followed by mixers and direct transfers to centralised exchanges.
This follows the pattern identified by Global Ledger in H1 2025, when bridges overtook mixers as the principal route for stolen funds. The H1 2026 findings indicate that attackers continue to move assets between blockchain ecosystems before interacting with privacy protocols or centralised services. The observed structure remains consistent with Global Ledger’s earlier findings.
Tornado Cash Retains Its Post-Sanctions Dominance
Where mixers were used, Tornado Cash accounted for 70% of all tracked cases, compared with 27.5% for RailGun and 2.5% for Umbra. This is particularly significant following the removal of US sanctions. Global Ledger recorded Tornado Cash at approximately 74% of tracked mixer usage in H2 2025 after sanctions were lifted. Its 70% share in H1 2026 shows that this dominance has persisted rather than fading after an initial increase. Tornado Cash therefore appears to have retained its position as the principal mixer used in hack-related laundering.
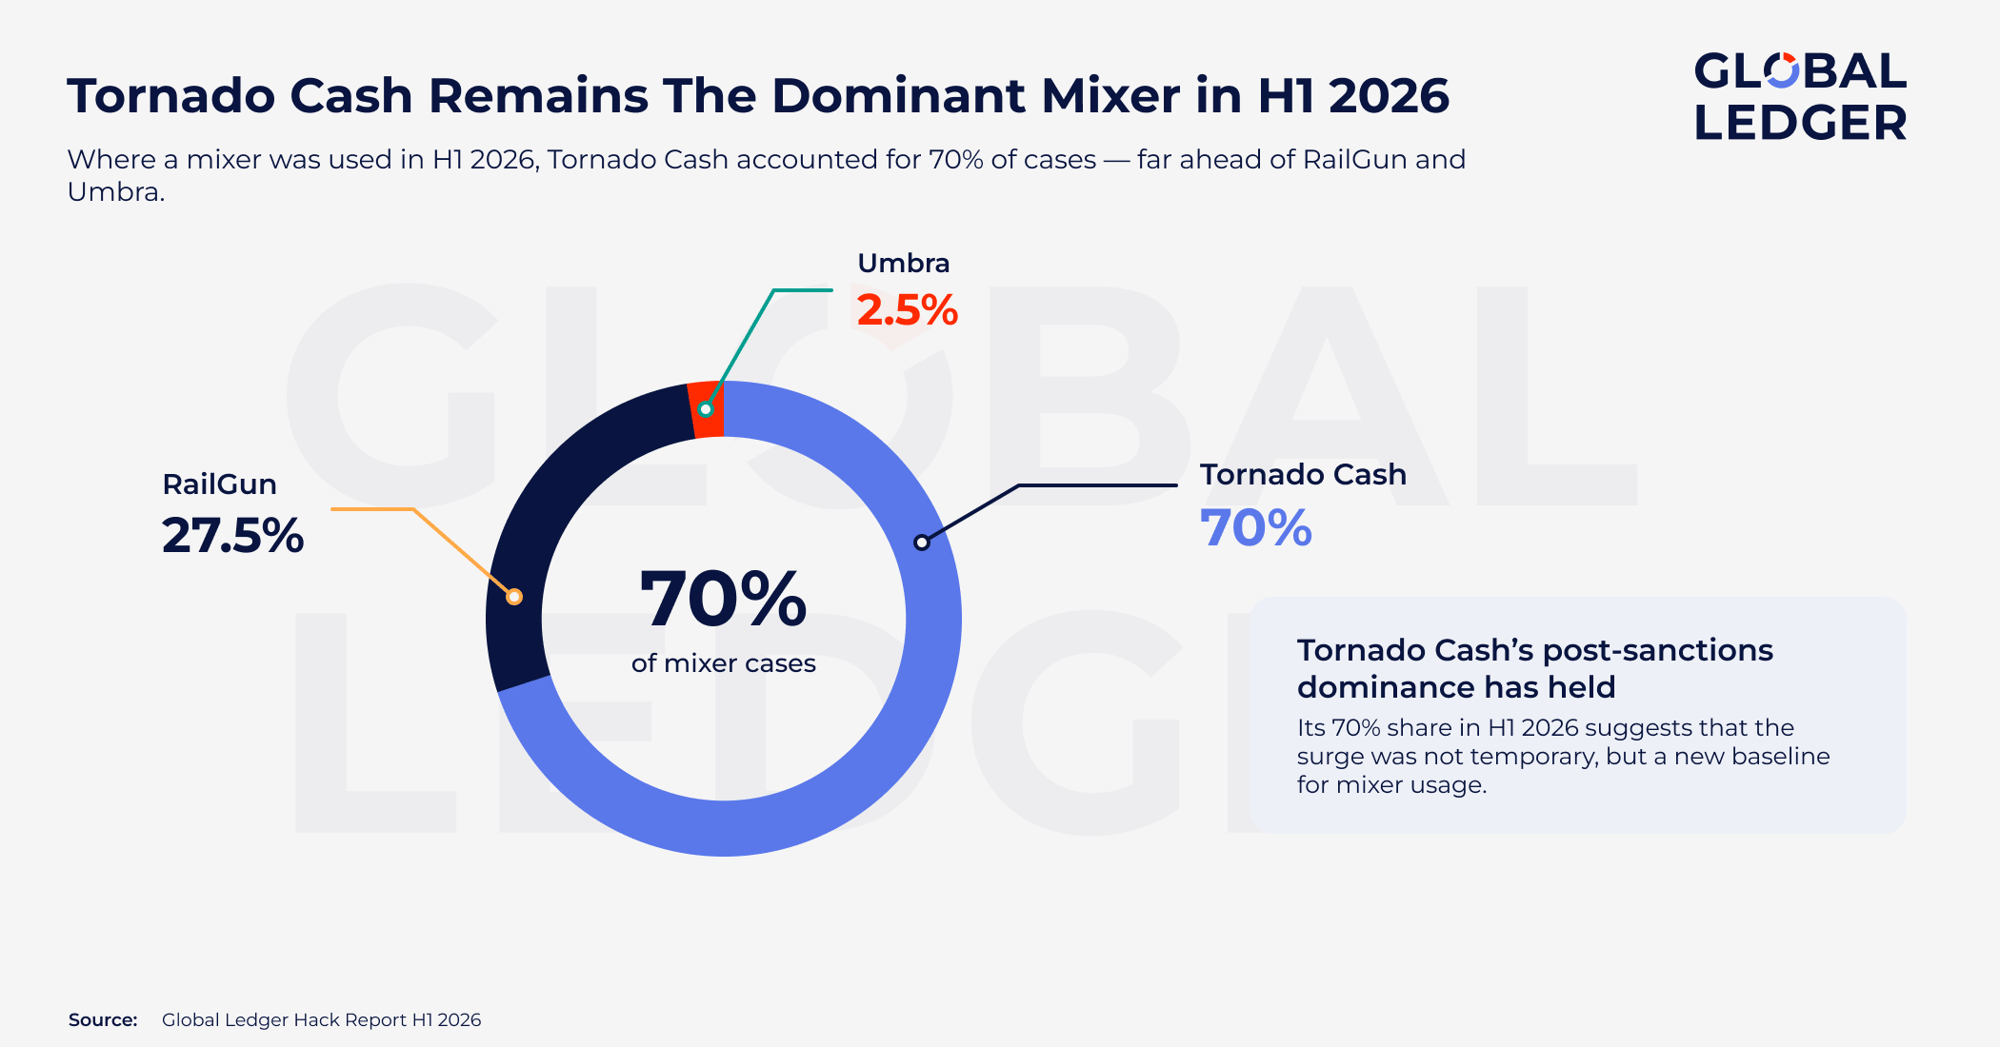
Most used crypto mixers for money laundering in H1 2026. Source: Global Ledger
Three Hacks Accounted for Nearly Two-Thirds of All Losses
Global Ledger recorded 224 hacks resulting in $1.32 billion in losses during H1 2026. However, the financial impact of the period was driven by a limited number of exceptionally large incidents rather than a broad increase in the severity of attacks across the ecosystem. Just three incidents—Kelp DAO, Trezor Value Wallet and Drift Protocol—accounted for $846.29 million, or 63.9% of all funds stolen. The remaining 221 incidents collectively represented slightly more than one-third of the total loss volume.
The same pattern is visible in the monthly data. April was the costliest month of H1 2026, with $635.88 million stolen, but 88.7% of that amount came from Kelp DAO and Drift Protocol alone. May recorded the highest number of incidents, at 56, but generated only $93.40 million in losses. The monthly figures therefore reflect the timing of several exceptional incidents rather than a sustained increase in attack severity.
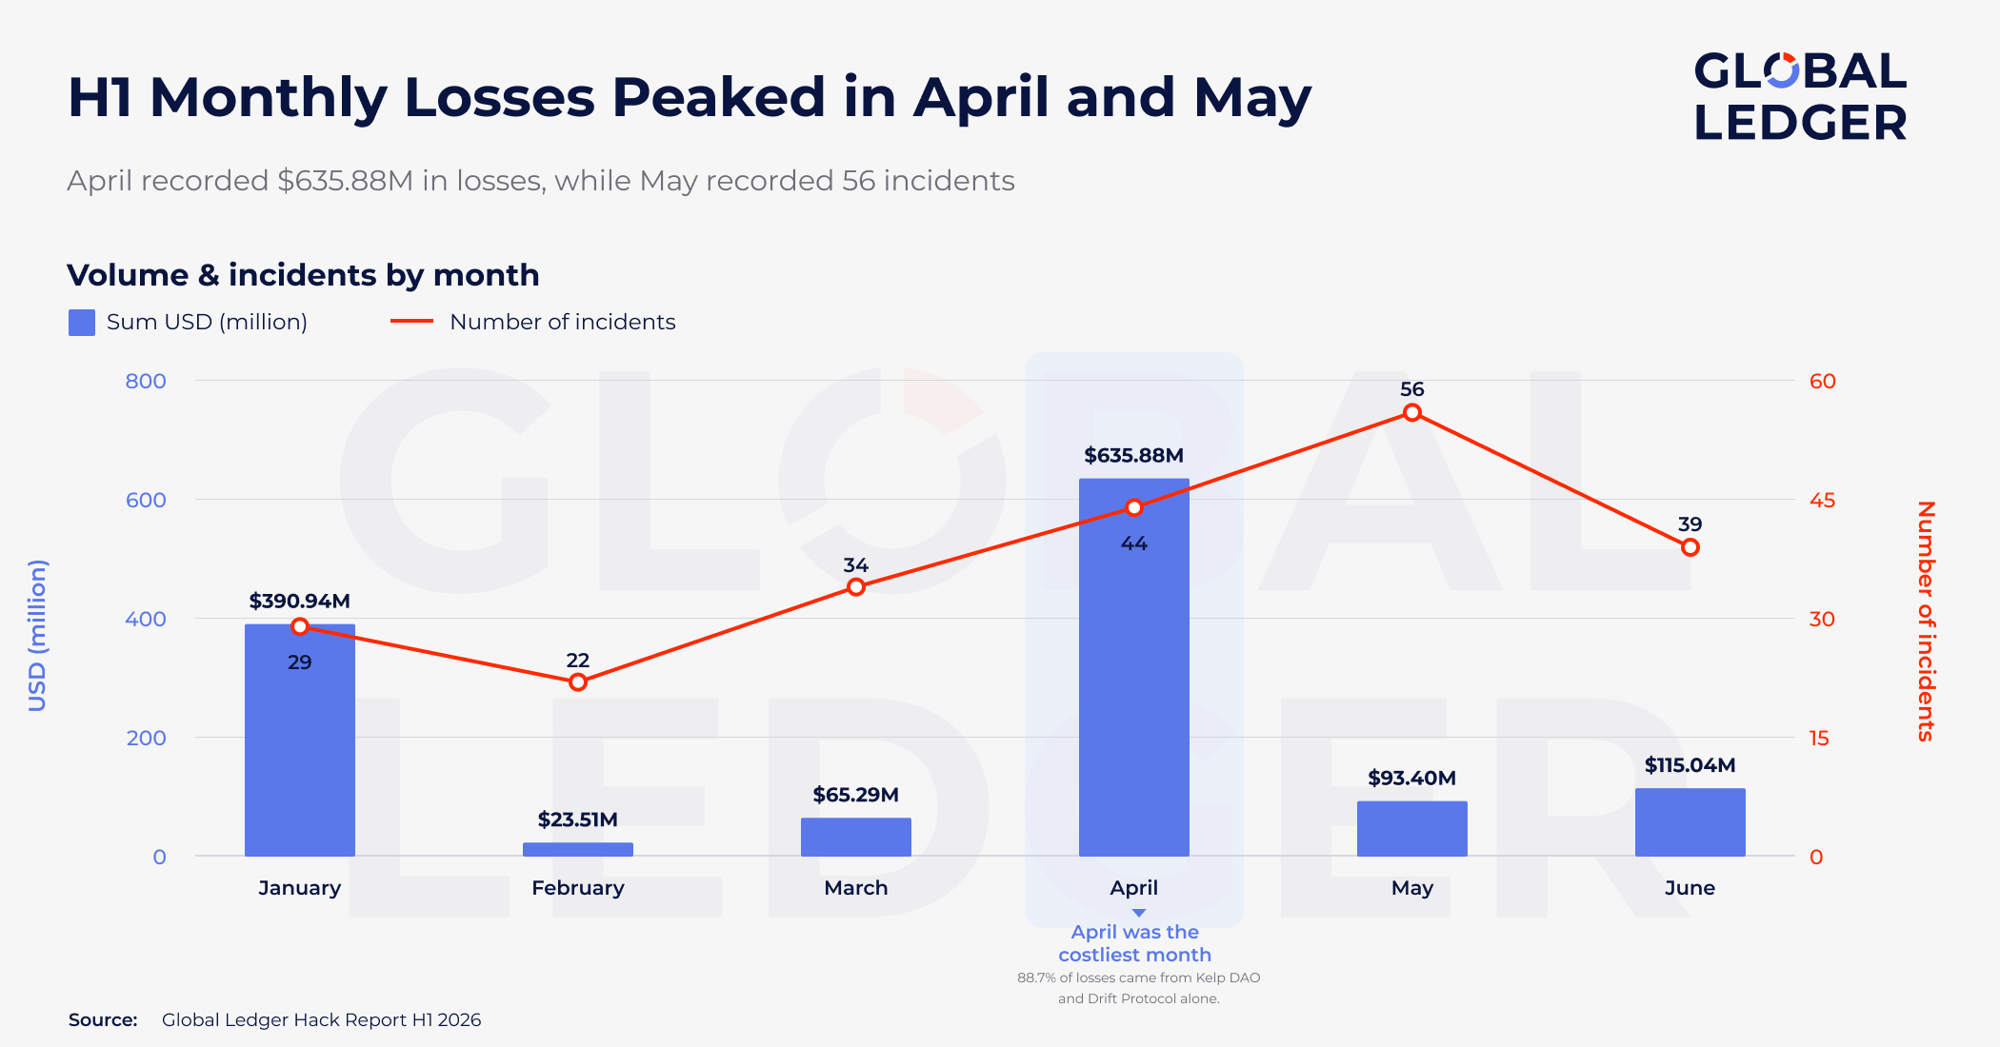
Monthly crypto losses in H1 2026, with April recording the highest losses. Source: Global Ledger
DPRK-Related Attacks Are Accountable For 46% of Losses
DPRK-attributed activity provides one of the clearest examples of this imbalance. Although DPRK-linked actors were responsible for just four confirmed incidents—1.8% of all hacks recorded during H1 2026—they accounted for $600.39 million, or 45.34% of total losses. This disproportionate impact reflects the exceptional scale of DPRK operations rather than their frequency. The average confirmed DPRK incident resulted in losses of $150.10 million, compared with $3.29 million for non-DPRK incidents, making the average DPRK-attributed hack approximately 46 times larger than the rest of the dataset. The analysis includes confirmed attributions only, so the total impact may be higher where links remain suspected but unconfirmed.
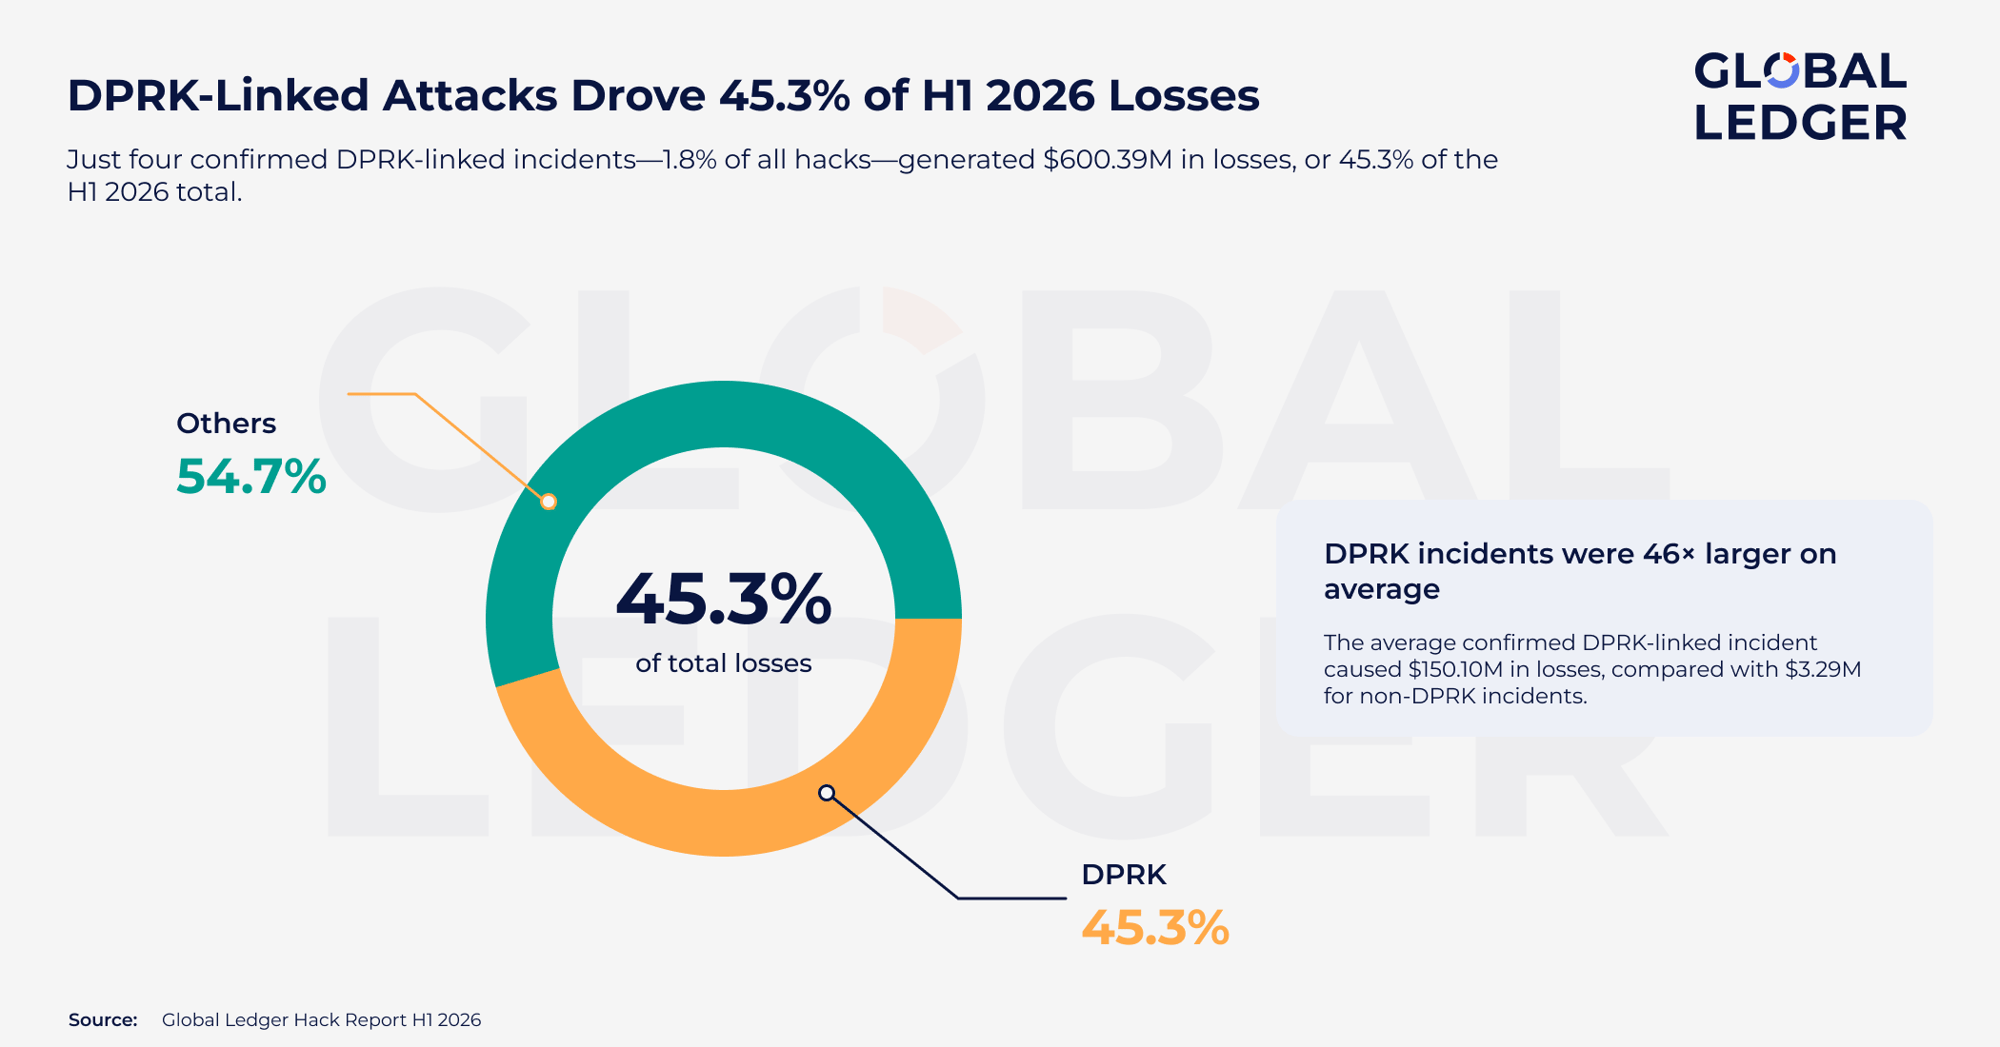
DPRK-associated hackers accounted for 45.3% of crypto losses in H1 2026. Source: Global Ledger
Individual Incidents Drove the Highest-Loss Entity Categories
Individual wallets recorded the highest total losses, at $306.17 million, followed by staking platforms at $298.44 million and trading platforms at $270.59 million. However, these rankings were largely driven by individual mega-incidents rather than sustained attack activity across each category. Approximately 92% of losses attributed to individual wallets came from the Trezor Value Wallet incident, while around 98% of staking losses came from Kelp DAO. The entire trading-platform loss was attributable to Drift Protocol.
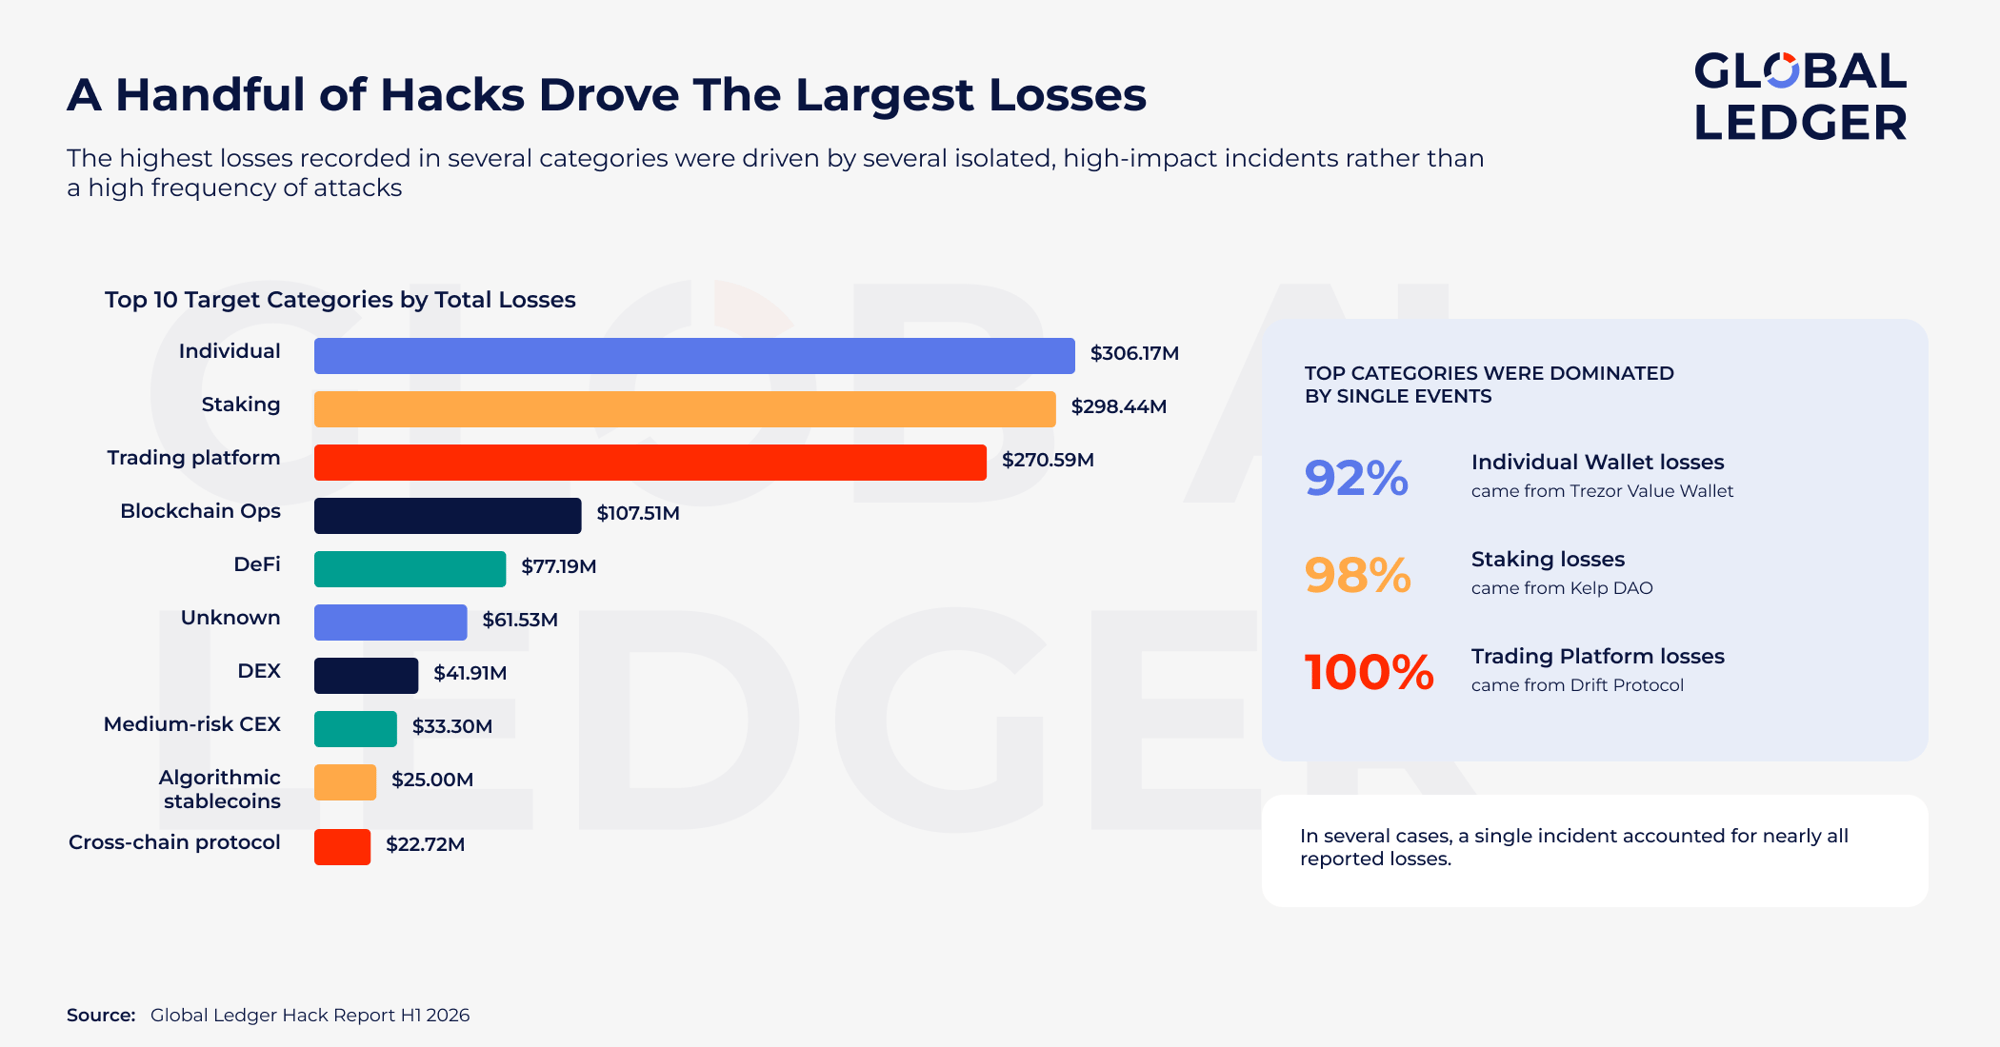
A few major hacks accounted for most losses in H1 2026. Source: Global Ledger
The distribution by incident count presents a different picture. DeFi protocols were targeted in 63 separate incidents, more than any other identified category, but generated a comparatively moderate $77.19 million in total losses. A further 57 incidents involved entities that could not be classified reliably, indicating that a substantial proportion of attacks affected smaller or less documented projects. The categories with the largest financial losses were therefore not necessarily those experiencing the most persistent attack activity.
Ethereum Leads by Both Incident Count and Total Losses
Ethereum recorded both the highest number of attacks and the largest total losses, with 91 incidents and $519.54 million stolen. However, the highest average loss per incident occurred on Bitcoin, where seven incidents averaged $49.58 million, largely because of the Trezor theft. Solana recorded only eight incidents, but averaged $38.43 million per case, primarily due to the Drift Protocol incident. BNB Smart Chain showed a markedly different pattern. It recorded the second-highest incident count, at 50, but the lowest average loss among major chains, at $0.52 million per incident. Its losses were spread across a long tail of smaller exploits rather than concentrated in one or two major events.
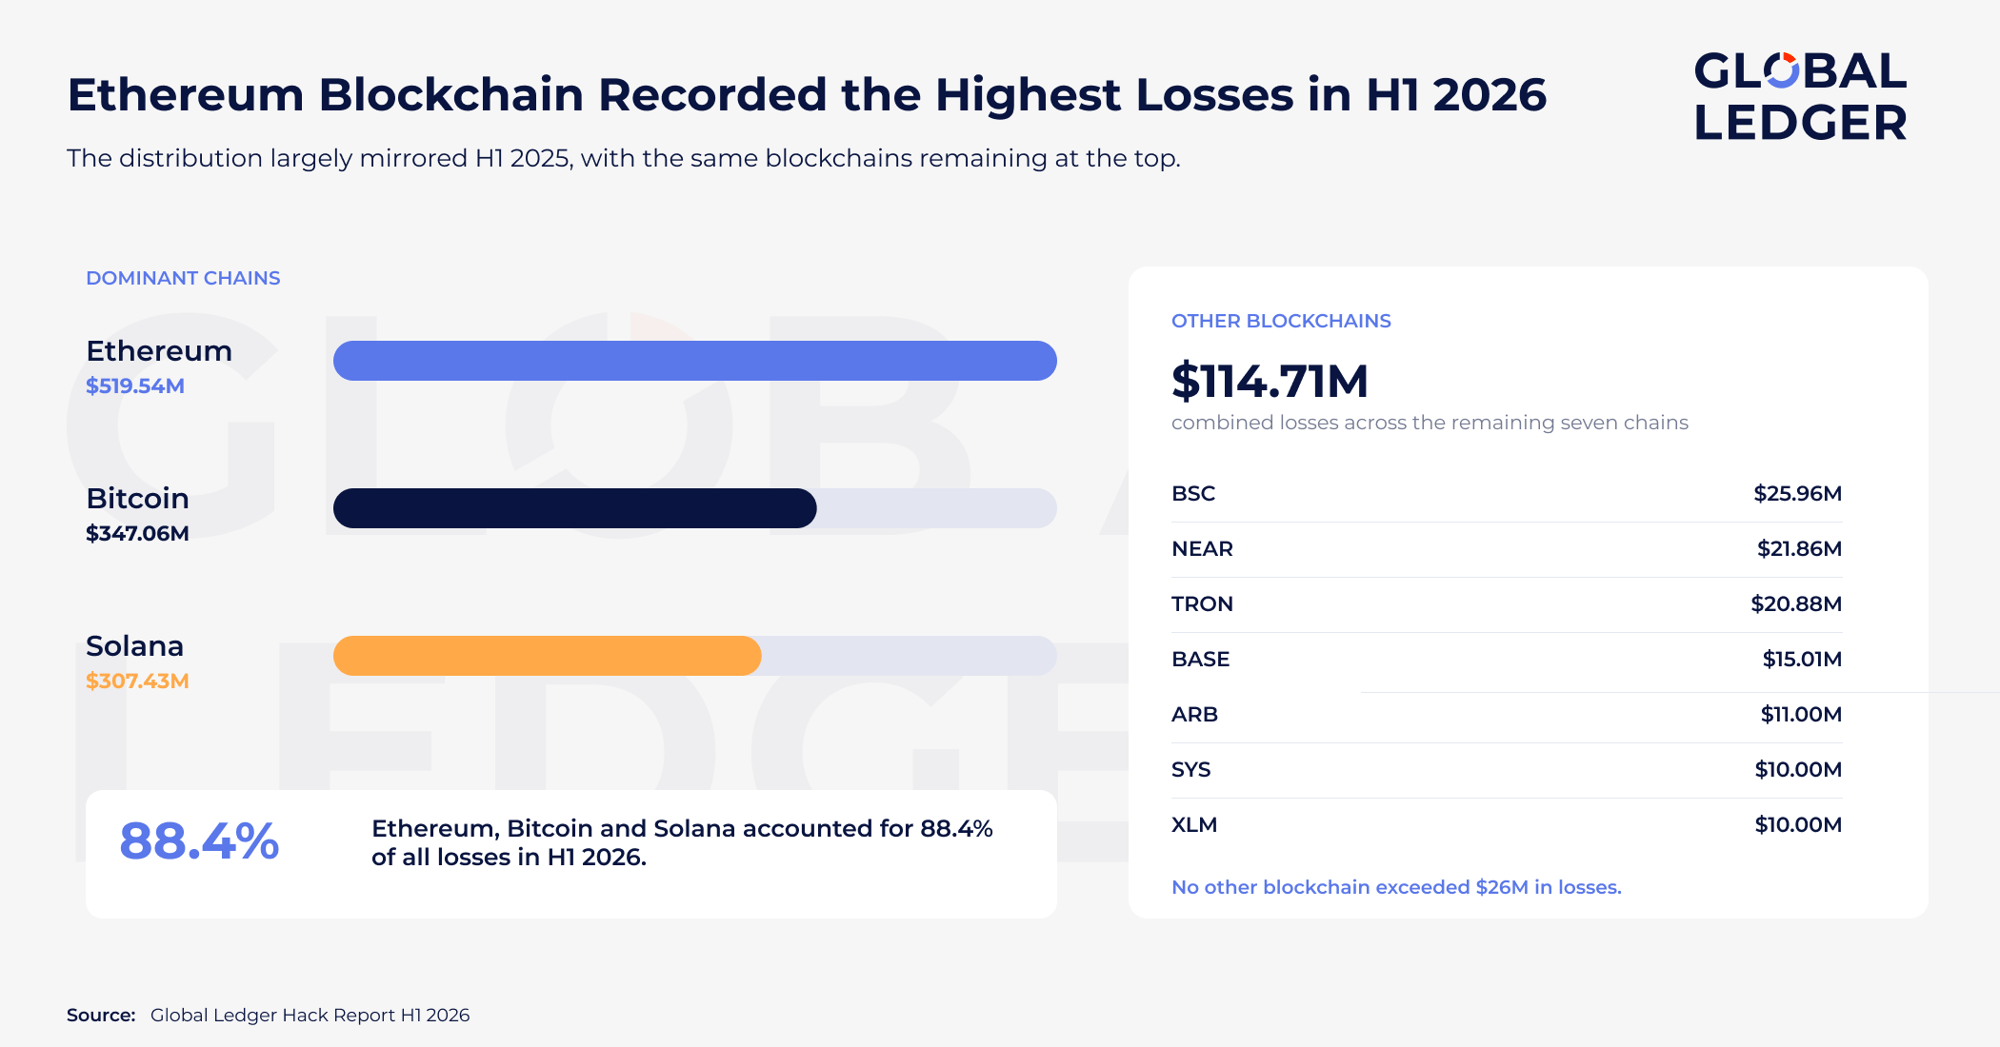
Breakdown of crypto losses by blockchain in H1 2026. Source: Global Ledger
Contract Exploits Remain the Most Common Attack Method
Contract exploits were the most common attack method by a wide margin, accounting for 150 incidents, or 67% of all cases, and $528.70 million in total losses. Yet they also produced the lowest average loss among the major attack methods, at $3.52 million per incident. Phishing occurred in only 14 incidents, but generated the highest average loss, at $20.60 million per incident, heavily influenced by the Trezor case. Private-key compromises followed with 29 incidents and an average loss of $15.52 million.
The pattern is consistent with Global Ledger’s H1 2025 findings, when contract exploits were also the most frequent method while less common malicious-approval and private-key incidents caused disproportionate financial damage. The methods responsible for the largest losses changed, but the broader distinction remained: common contract-level attacks produced many comparatively smaller losses, while less frequent credential, access and signing compromises generated much larger individual losses.
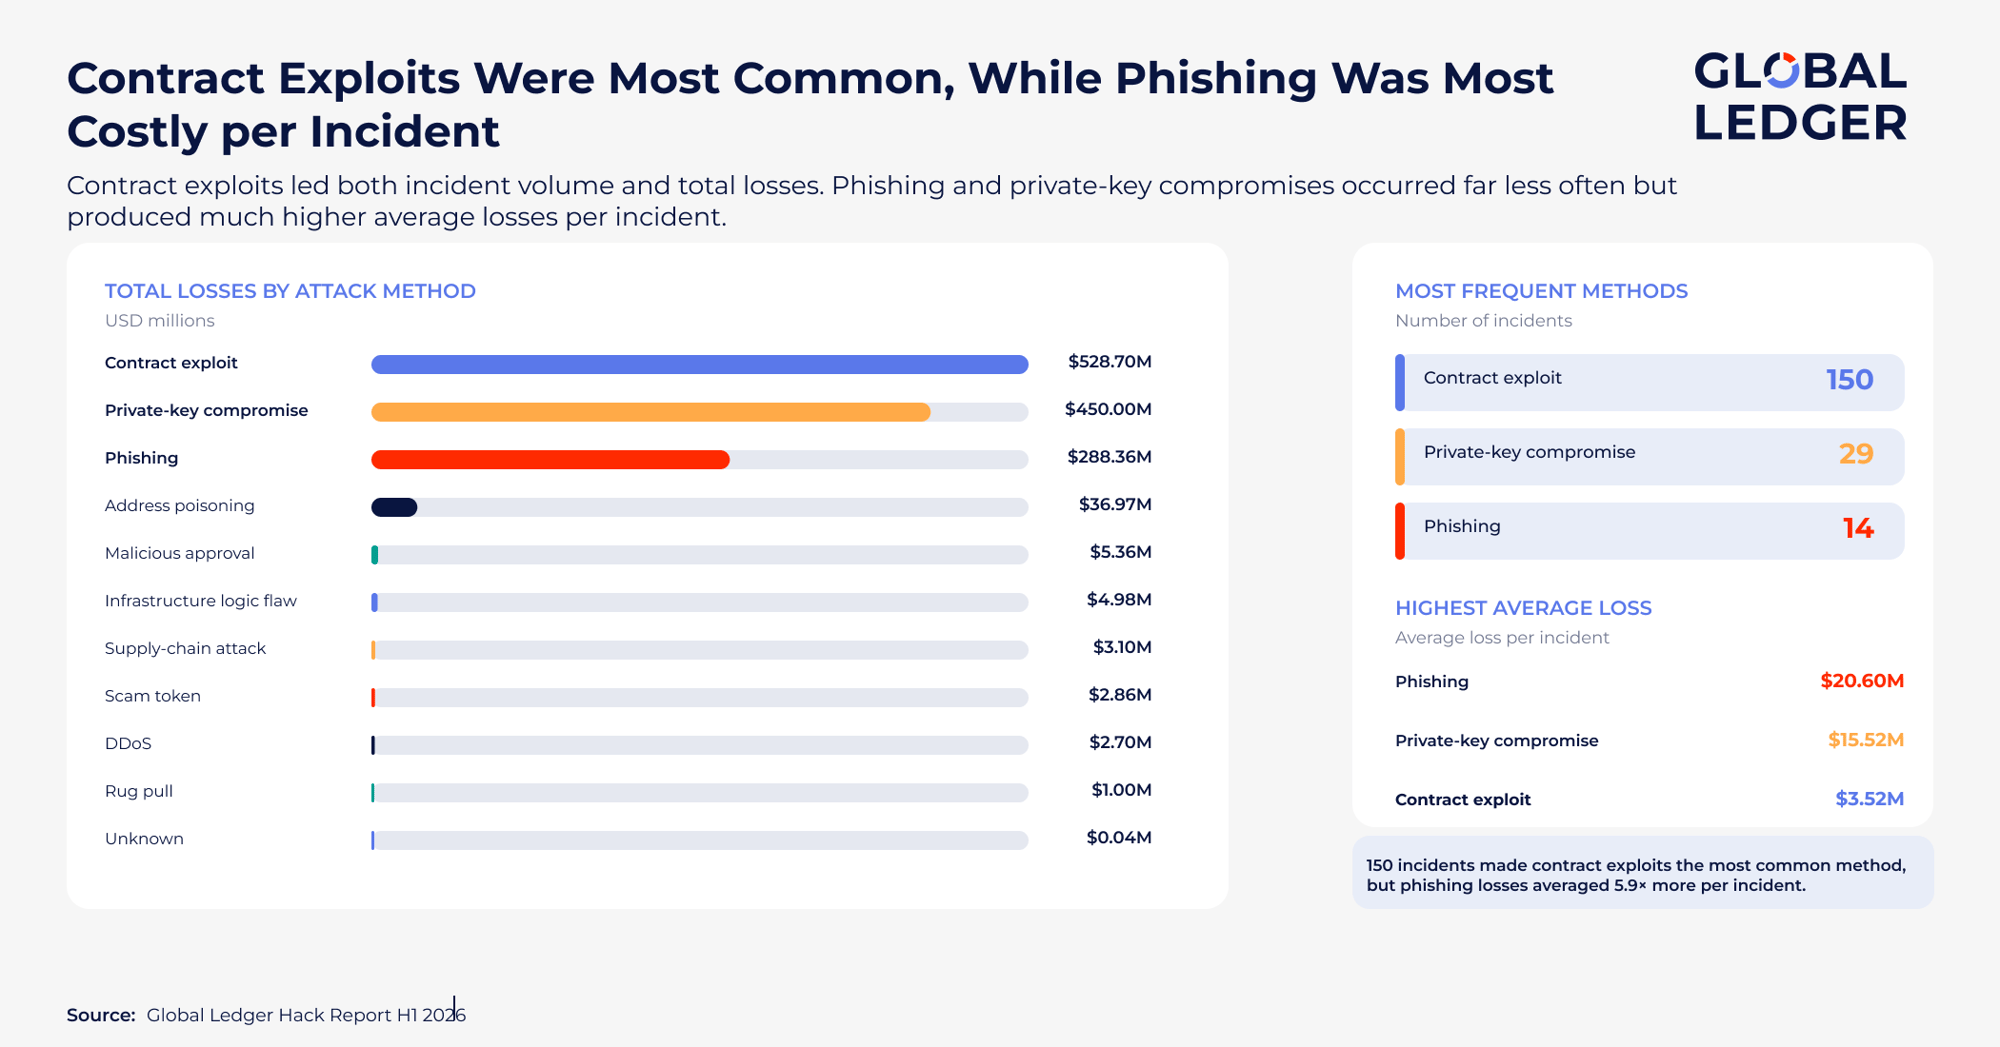
Crypto losses by attack type in H1 2026. Source: Global Ledger
Recovery Is Improving Through Faster and More Coordinated Intervention
The improvement in recovery outcomes during H1 2026 was also supported by a broader range of response mechanisms. Successful interventions involved different combinations of blockchain tracing, protocol governance, stablecoin controls, automated monitoring and direct negotiations with attackers.
The Kelp DAO case demonstrated how protocol governance can be used to interrupt the movement of stolen assets. Arbitrum’s Security Council temporarily upgraded a core L1 contract, used it to impersonate the exploiter’s address and redirected $71 million to a burn address before reverting the upgrade. The funds remained frozen pending a future governance decision. This was the first recorded use of an Arbitrum Security Council intervention in this form.
The Drift Protocol incident highlighted the role and limits of stablecoin issuers. Circle declined to freeze the USDC involved without a law-enforcement or court order, while Tether took a different approach by extending $127.5 million to make affected users whole. The case shows how issuer policies can produce materially different outcomes even when the underlying assets and incident are already visible on-chain.
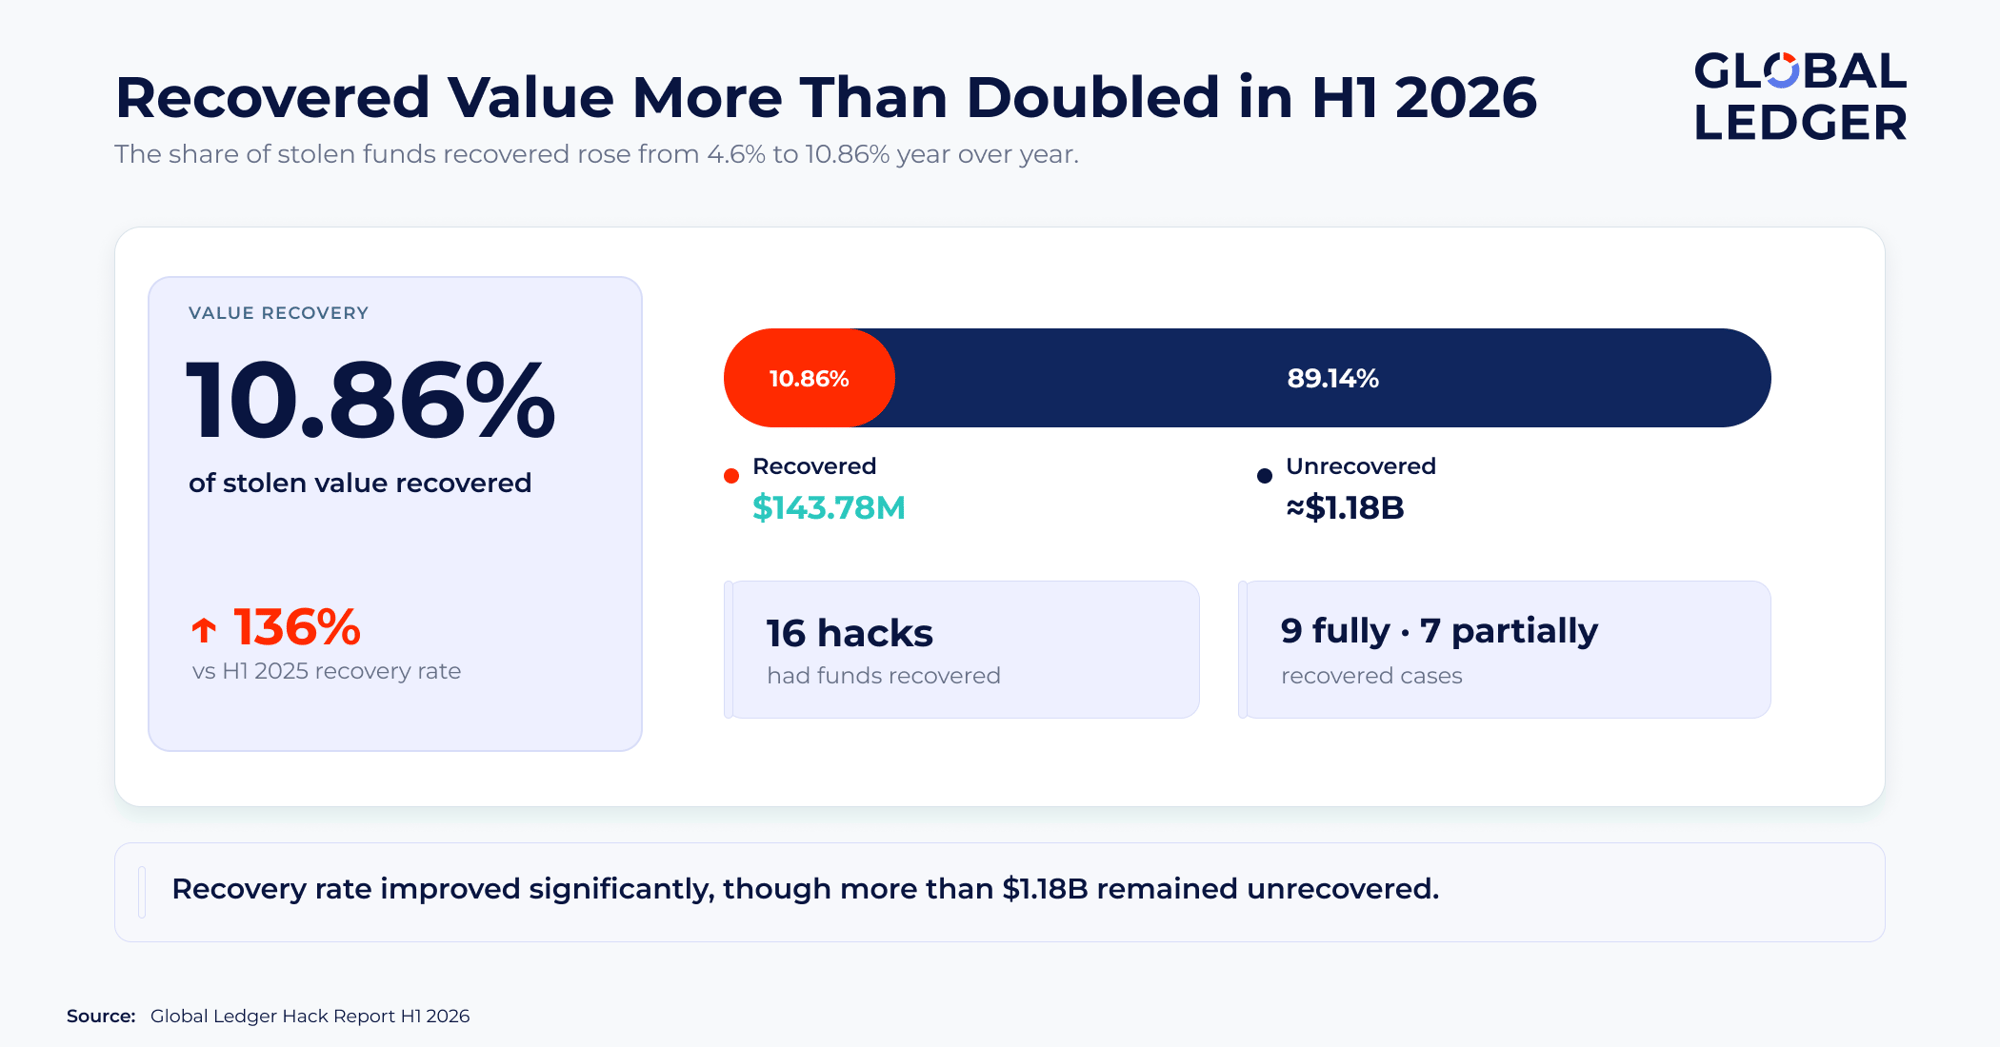
Recovered value doubled in H1 2026. Source: Global Ledger
Direct negotiation also became a recurring recovery route. In three separate incidents involving Resolv Labs, TAC and Rhea Finance, attackers accepted bounties of approximately 10% and returned the remaining funds. These cases demonstrate that negotiated recovery can operate alongside freezes, governance intervention and formal enforcement rather than relying on any single response mechanism. Automated monitoring provided another form of protection in the THORChain incident. A malicious validator exploited the network’s threshold-signature scheme to reconstruct a private key, but automated solvency monitoring halted trading within minutes. The $10.7 million loss was absorbed by protocol-owned liquidity, and no individual users were affected.
The H1 2026 case studies show that recovery is increasingly an ecosystem capability. Outcomes depend on affected projects, analytics providers, exchanges, stablecoin issuers, governance bodies, security researchers and law-enforcement agencies being able to act on the same information quickly and in coordination.
Earlier public disclosure does not guarantee recovery, but it enables these mechanisms to begin operating sooner. Combined with improved tracing, asset controls and more varied intervention methods, this helps explain why the proportion of stolen value returned increased substantially compared with H1 2025.
Conclusion
The findings of H1 2026 present a mixed but encouraging picture of the current crypto security landscape. While attackers continue to rely on established laundering techniques and a small number of incidents still account for the majority of financial losses, the industry’s ability to detect, disclose and respond to hacks has improved noticeably over the past year.
Earlier public reporting, stronger coordination between ecosystem participants and a wider range of recovery mechanisms are contributing to better post-incident outcomes. Although full recovery remains the exception rather than the norm, the data suggests that defenders are gradually narrowing the operational advantage traditionally held by attackers.
Taken together, the findings indicate that the greatest changes in H1 2026 occurred not in how funds are stolen or laundered, but in how quickly the ecosystem is able to identify incidents, coordinate a response and disrupt the movement of stolen assets. This growing operational maturity is likely to remain one of the defining trends shaping crypto security in the years ahead.